Introduction
Instructor: Fatih Kansoy
PhD in Economics - School of Economic | University of Nottingham
Worked Nottingham Business School, Joined Warwick 2019
MSc in Economics - University of Warwick .
Office: S1.113 - No online office hours
Office Hours: Friday 09:00 - 11:00 1
- Appointment: https://calendly.com/kansoy
Email: f.kansoy@warwick.ac.uk
Website: www.fatih.ai
Course Website: http://www.macroeconomics.info
Course Organisation
Lectures:
- When: Weeks 16-24 Tuesdays 09:00 - 11:00 / 15:00-17:00 | Where: R0.21 / 1.015
Seminars:
- When and Where: Check your tabula/timetable
- Who: Assistant Professor Eman Abdulla
- Email: Eman.Abdulla@warwick.ac.uk
- Office: S0.06
Course Materials - Moodle
- All materials and announcements are in Moodle
Course Assesments
- MCQ Test and \(20\%\) in March -
- Essay based question \(80\%\) and in May/June -
Rules
You can eat, drink, WhatsApping, sleep during the lecture.
BUT no distractions to others!
Attendance is not compulsory, up to you. If you come you can learn better!
Readings - General
Olivier Blanchard: Macroeconomics, 6, 7 or 8th Edition Blanchard (2021)
Charles I. Jones: Macroeconomics, 4 or 5th Edition Jones (2020)
Barro, Cozzi & Chu Intermediate Macroeconomics \(1^{st}\) Edition Barro, Chu, and Cozzi (2017)
Eric Sims, Garin & Lester Intermediate Macroeconomics Sims, Garin, and Lester (Accessed in 2024)
Abel, Andrew B. and Bernanke, Ben S. and Croushore, Dean \(11^{th}\) Edition Abel, Bernanke, and Croushore (2024)
Schmitt-Grohé, Uribe and Woodford International Macroeconomics Schmitt-Grohé, Uribe, and Woodford (2022)
And some other updated readings from the economist, financial times, WSJ, IMF etc.
Readings for Lecture 1
Chapters 1 and 2 in S. Olivier Blanchard: Macroeconomics, 6, 7 or 8th Edition
Chapters 1 and 2 in Charles I. Jones: Macroeconomics, 4 or 5th Edition
Chapters 1 and 2 in Barro, Cozzi & Chu Intermediate Macroeconomics 1st Edition
What is macroeconomics?
Micro vs Macro
Before you studied microeconomics which focuses on the study of individual people, firms, or markets.
Macroeconomics is the study of collections of people and firms and how their interactions through markets determine the overall economic activity in a country or region.
Actually, the best way to answer is not giving a formal definition, but rather
- to take you on an economic tour of the world,
- to describe both the main economic evolutions and the issues that keep macroeconomists and macroeconomic policymakers awake at night.
What we are going to cover:
Economic growth
- Why is the American of today 50 times richer than the typical Ethiopian?
Unemployment
- How do we understand the impact of Covid-19 on world economic, the recent global financial crisis, the Great Recession 1929, and the European debt crisis of recent years?
Inflation
What determines the rate of inflation?
Why was inflation so high in much of the world in the 1970s, and why has it fallen so dramatically in many of the richest countries since the early 1980s and again started to rise once again?
Financial Markets
- What is a “bubble,” and how can we tell if the stock market or the housing market is in one?
One Event Many Different Impacts
Global Financial Recession 2008 and Covid-19 2021:
- 2000- 2007 sustained expansion
- Advanced economies grew at 2.7% per year
- Emerging economies grew at 6.5% per year
- The US crisis quickly became a world financial crisis
One Event Many Different Impacts
From 2000 to 2007, the world economy had a sustained expansion.
In 2007, U.S. housing prices started declining, leading to a major financial crisis.
The financial crisis turned into a major economic crisis then millions lost their jobs and homes
In the third quarter of 2008, U.S. output growth turned negative and remained so in 2009.
Through the trade and financial channels, the U.S. crisis quickly became a world financial crisis.
Financial Recessions and Stock Markets
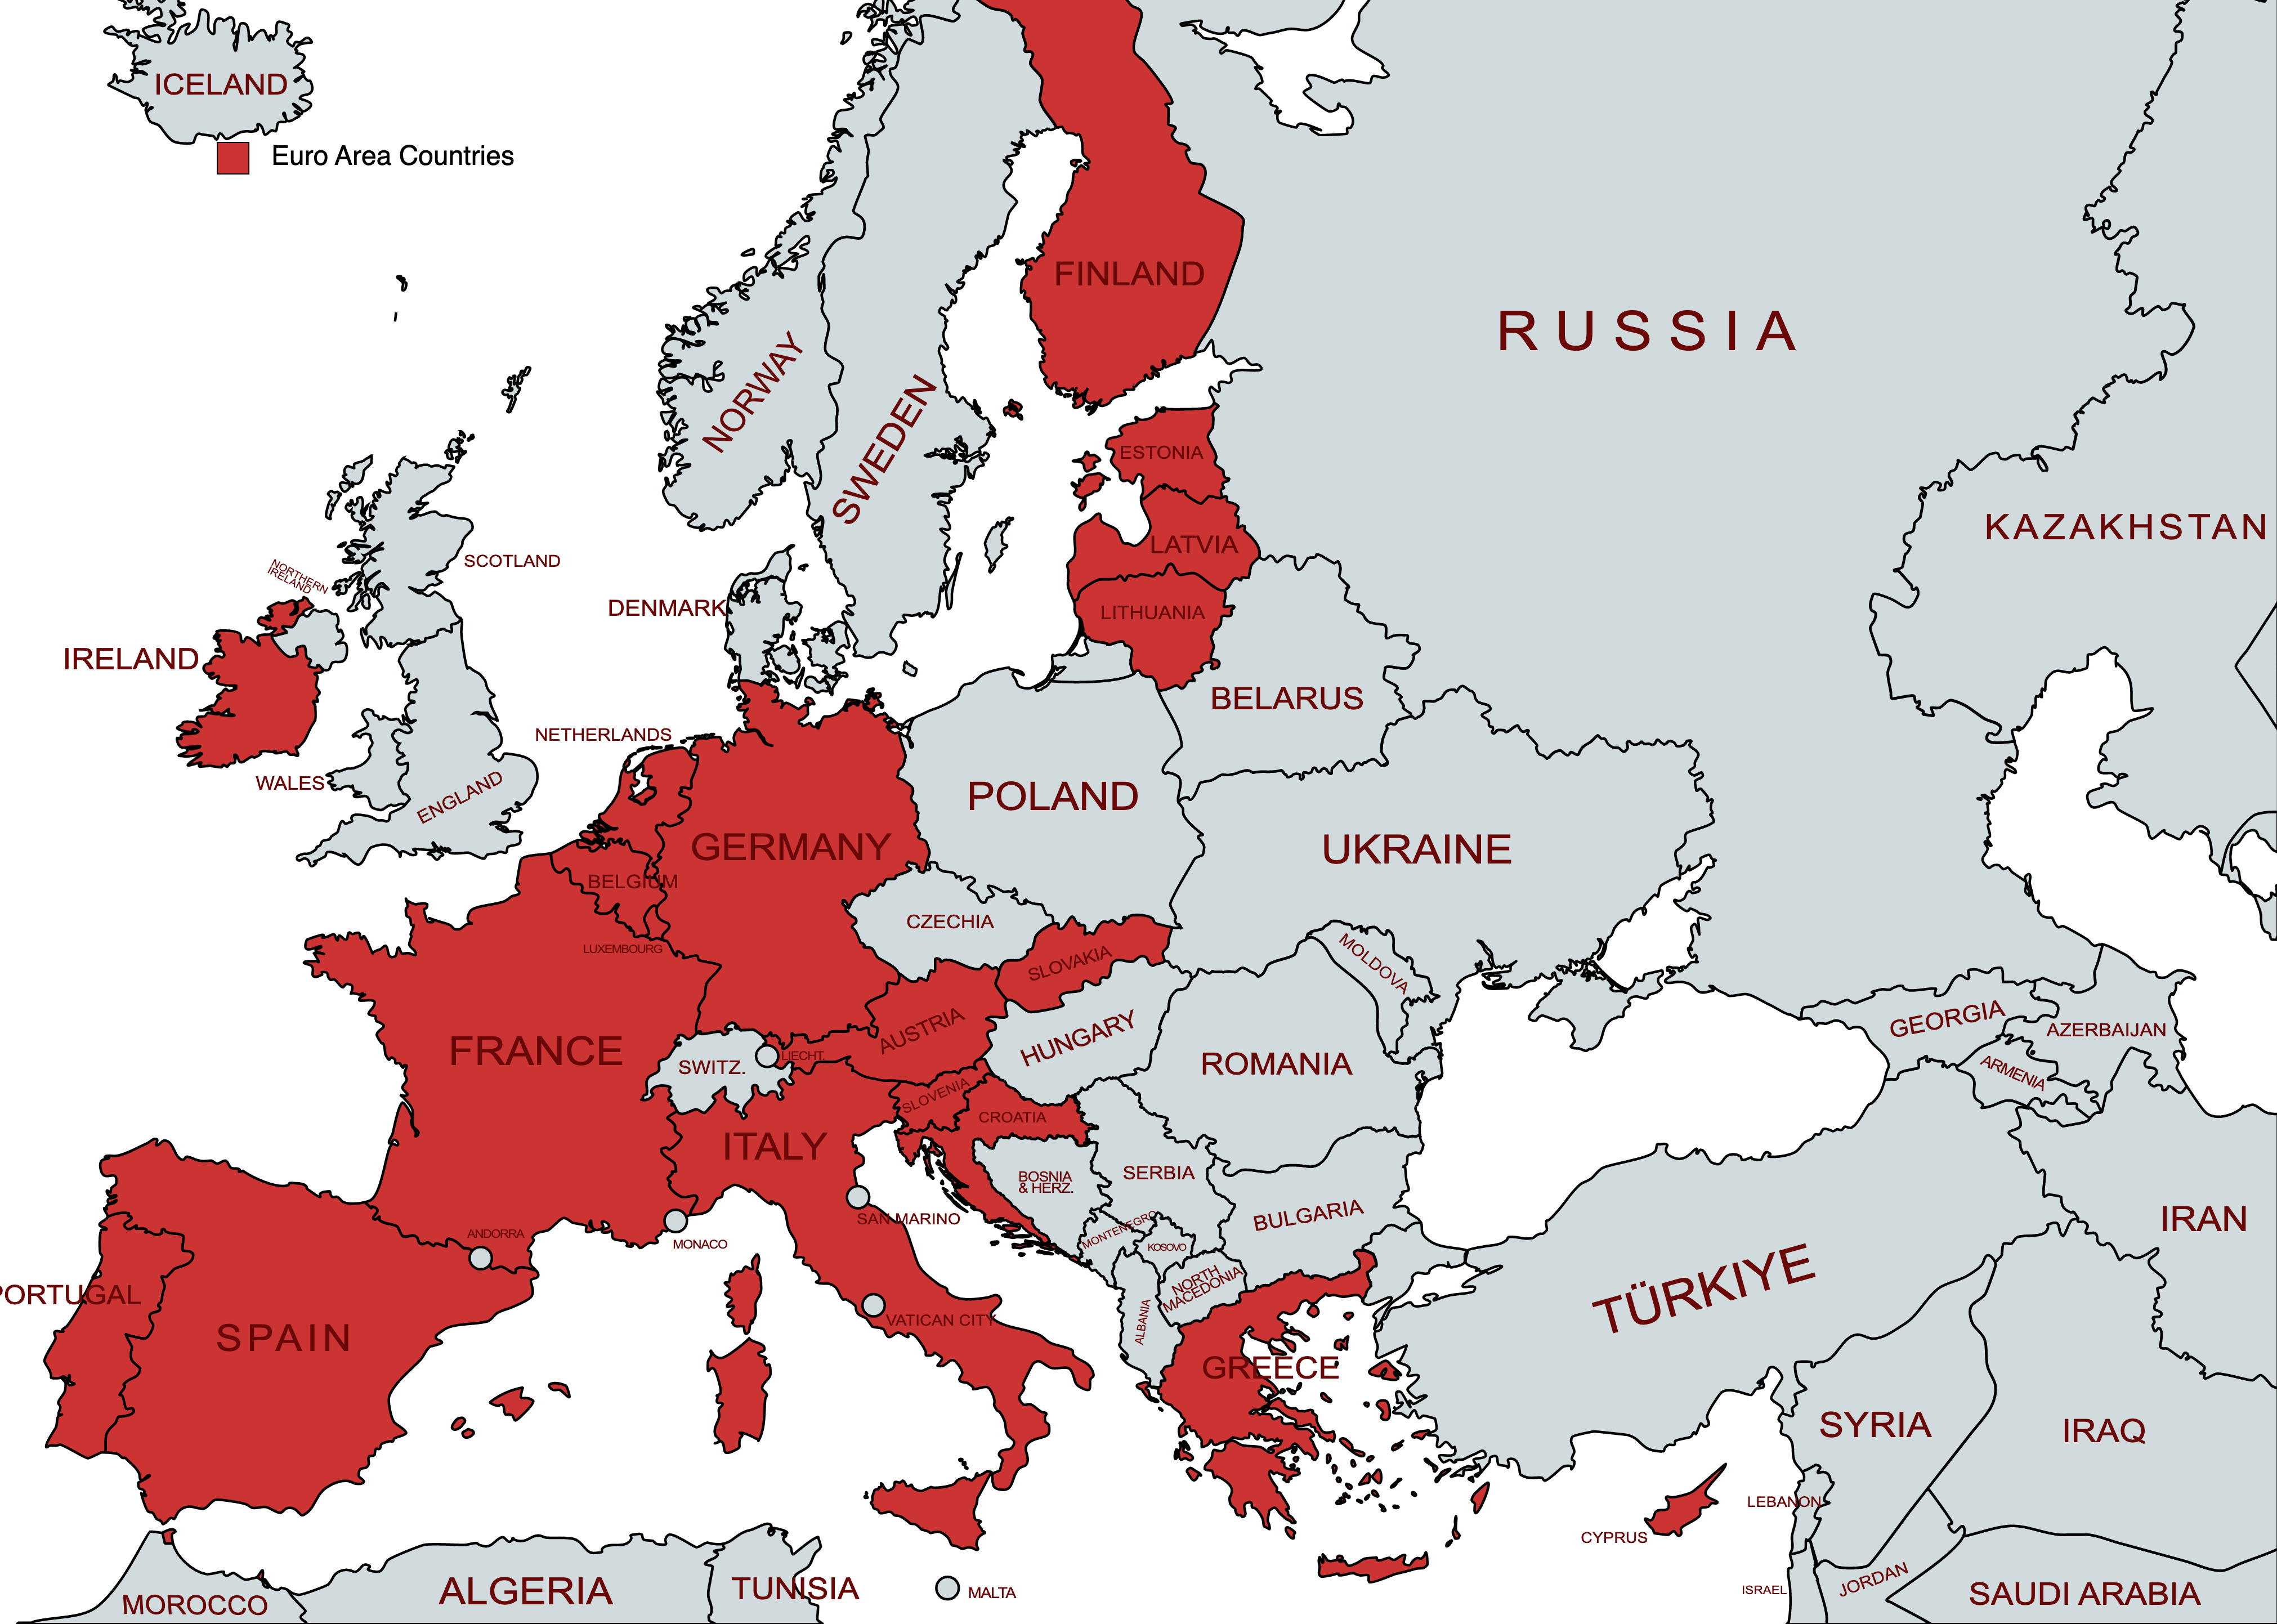
The Euro Area
The European Union (EU) is currently a group of 27 European countries with a common market.
Brexit: The United Kingdom withdrew from the European Union on January 31, 2020.
In 1999, the EU formed a common currency area called the Euro Area, which replaced national currencies in 2002 with the euro.
The Euro area faces two main issues today:
- How to reduce unemployment?
- How to function efficiently as a common currency area?
Output growth in the Euro area is still lower than pre-crisis time.
In 2018, output growth was below the pre-crisis average and the unemployment rate was 8.3%.
| Macro Variables | 1990-2007 | 2008–2009 | 2010–2017 | 2018-2021 |
|---|---|---|---|---|
| Output growth rate (%) | 2.2 | -2.0 | 1.3 | 0.63 |
| Unemployment rate (%) | 9.6 | 8.6 | 10.6 | 7.8 |
| Inflation rate (%) | 3.1 | 2.2 | 1.29 | 1.47 |
Note. Output growth rate: annual rate of growth of output (GDP). Unemployment rate: average over the year. Inflation rate: annual rate of change of the price level (CPI). Source: IMF, World Economic Outlook, October 2022.
While the average unemployment rate for the Euro area was \(8.3\%\) in 2018, countries like Spain had an unemployment rate of \(15\%\).
Much of the high unemployment rate was the result of the crisis. (?)
Even when Spain had its lowest unemployment rate of \(8\%\), it was nearly three times that of the Germany today.
Some economists believe labour market rigidities with too much protection for workers are the main problem.
Supporters of the euro argue:
economic advantages due to no more changes in exchange rates to worry about
its contribution to the creation of a large economic power
Others argue:
the drawback of a common monetary policy across euro countries
the loss of the exchange rate as an adjustment instrument within the euro area
Unemployment
All Countries
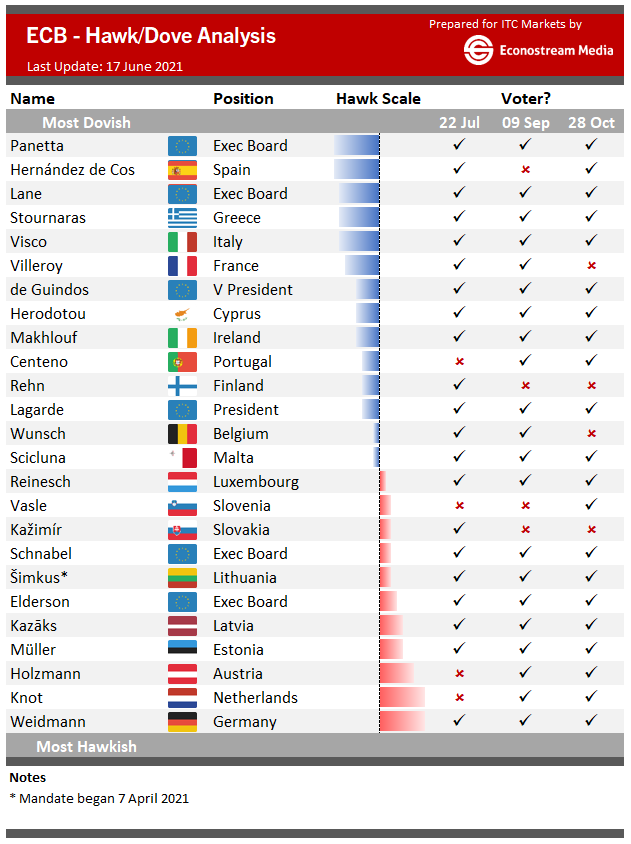
ECB Monetary Policy:
The United States
The United States is big
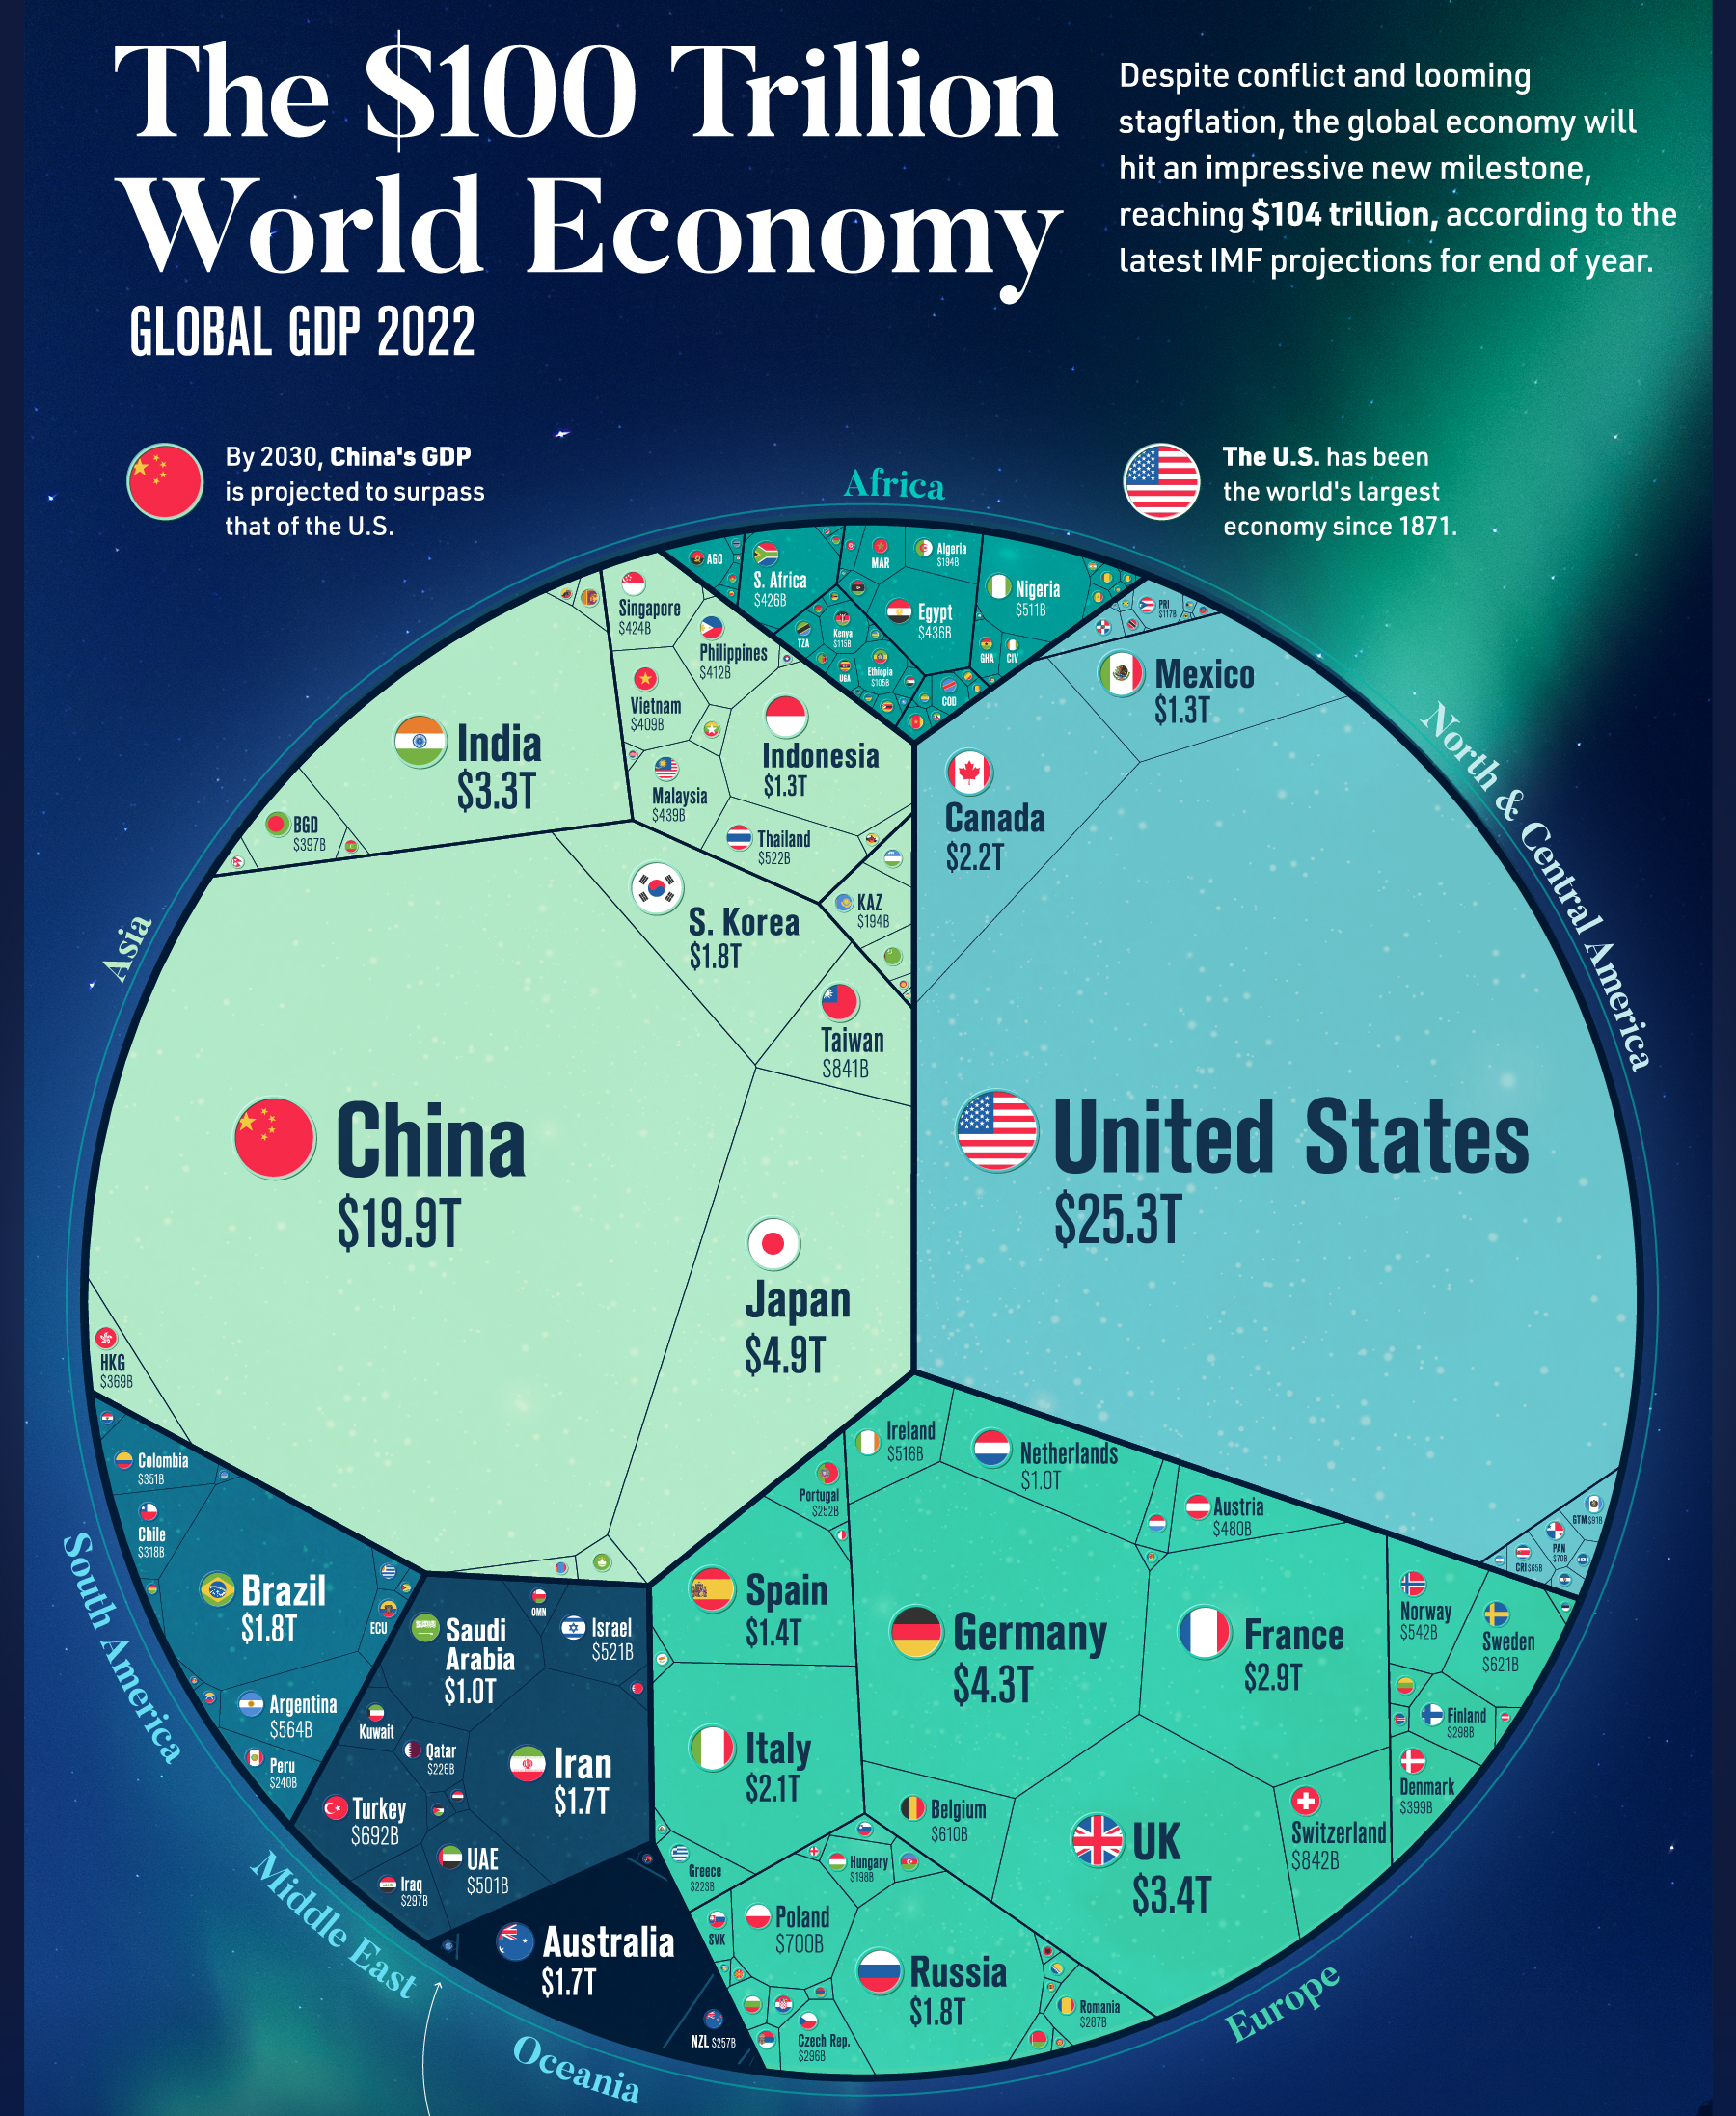
- With an output of \(\$26185\) trillion in 2023, it accounted for \(25\%\) of world output.
The U.S. standard of living is high
- Output per capita is approximately \(\$75000\) close to the highest in the world.
The U.S. economy in 2021 was in good shape, leaving the effects of the 2008-2009 crisis behind with one of the longest economic expansions on record.
Can we say the same thing in 2023?
| Macro Variables | 1990-2007 | 2008-2009 | 2010-2017 | 2018-2021 |
|---|---|---|---|---|
| Output growth rate (%) | 2.99 | -1.23 | 2.16 | 2.1 |
| Unemployment rate (%) | 5.4 | 7.5 | 6.8 | 5.2 |
| Inflation rate (%) | 2.9 | 1.7 | 1.6 | 2.5 |
Note: Output growth rate: annual rate of growth of output (GDP). Unemployment rate: average over the year. Inflation rate: annual rate of change of the price level (CPI). Source: IMF, World Economic Outlook, October 2022.
The U.S. Federal Funds Rate since 1990
Financial Recessions and Stock Markets
Why did the Federal Funds rate stop at zero?
This constraint is known as the zero lower bound.
If it were negative, then everyone would hold cash rather than bonds.
Why are low interest rates a potential issue?
Low interest rates limit the Fed’s ability to respond to further negative shocks.
Low interest rates may lead to excessive risk taking by investors to increase their returns.
China
China is in the news every day.
Its population is more than four times that of the United States.
But its output at $19 trillion is about 75% of the United States.
Output per person is roughly 18% of that of the United States.
China has been growing very rapidly for more than three decades.
China’s rapid output growth has been driven by a high accumulation of capital and technological progress.
The slowdown after the crisis is considered to be desirable as more of output would go to consumption instead of investment.
| Macro Variables | 1990-2007 | 2008-2009 | 2010-2017 | 2018-2021 |
|---|---|---|---|---|
| Output growth rate (%) | 10.2 | 9.5 | 8.0 | 5.7 |
| Unemployment rate (%) | 3.2 | 4.25 | 4.05 | 5.2 |
| Inflation rate (%) | 5.05 | 2.59 | 2.61 | 2.09 |
Note: Output growth rate: annual rate of growth of output (G D P). Unemployment rate: average over the year. Inflation rate: annual rate of change of the price level (CPI). Source:IMF, World Economic Outlook, October 2022.
Why / How / Which Topics?
Why? Why should we study macroeconomics?

How? How does macroeconomics answer those questions?
The Structure of Economics Models

Which Topics? Economic Growth
Aggregate Output: Economic Growth
Once upon a time there was NO GDP.
In other words, there was no measure of aggregate activity on which to rely
Economists put together bits and pieces of information, such sales at some department stores, to try to infer what was happening to the overall economy.
After World War II the measures of national income and product accounts were constructed. We can say this is the first GDP calculation.2
The measure of aggregate output is called gross domestic product (GDP).
Gross domestic product (GDP):
is the market value of all final goods and services produced within a country in a given period of time.
Investment
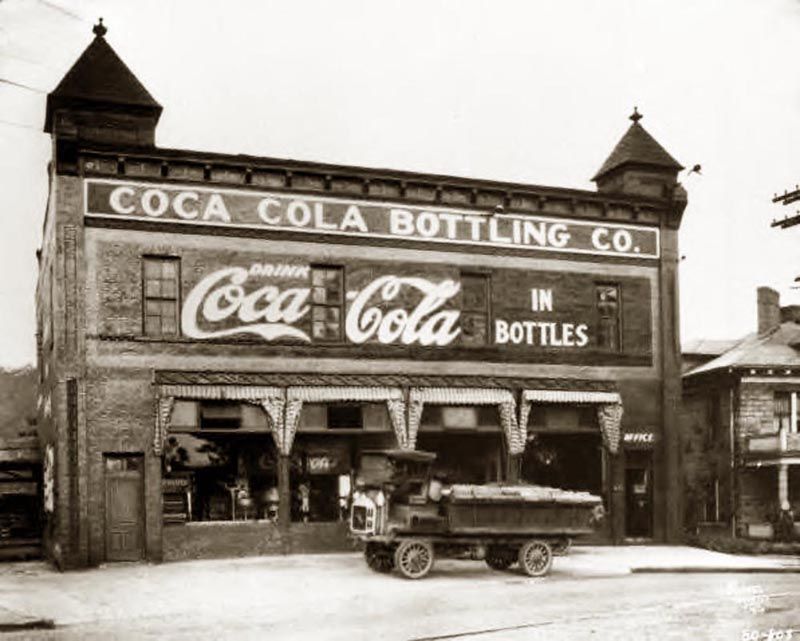
Coca Cola builds a new bottling plant in the United States
YES! It is an investment spending and included in GDP
:::
GDP is a flow variable.
Northwest Airlines sells one of its existing airplanes to Korean Air.
No! It does not represent production in the current time period. The plane was already included in the production year, so sale of used item is not part of GDP.

GDP and Financial Transaction
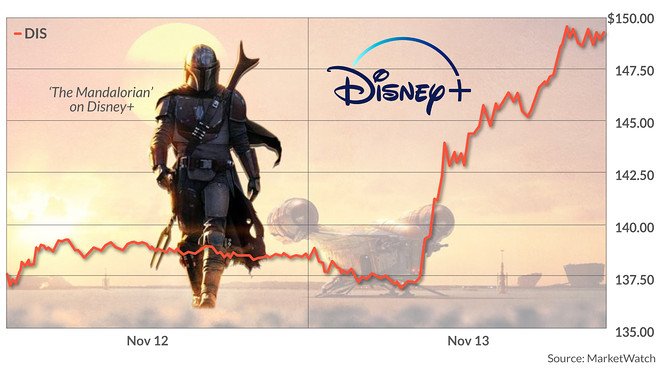
Ms. Moneybags buys an existing share of Disney stock.
NO! When an individual buys an existing share of stock the transaction is a financial one, therefore it is not included in the GDP
GDP and Export
A California winery produces a bottle of Chardonay and sells it to a customer in Montreal.
YES! It is an export and is entered in US GDP

A working example for aggregate output
- Chip company produces chip, employing workers and using machines to produce the chip.
- Phone company buys the chip and uses it, together with workers and machines, to produce phone.
| Chip Company | - | + |
|---|---|---|
| Revenue from sales $ | 100 | |
| Expenses $ | 80 | |
| Wages $ | 80 | |
| Profit $ | 20 | |
| Phone Company | - | + |
|---|---|---|
| Revenue from sales $ | 200 | |
| Expenses $ | 170 | |
| Wages $ | 70 | |
| Chip Purchases $ | 100 | |
| Profit $ | 30 | |
- What is the aggregate output?
- 200
- Chip is an intermediate good, which is a good used in the production of another good.
- 1 - GDP is the value of the final goods and services produced in the economy during a given period.
- Suppose the two firms merged, so that the sale of chip took place in the new firm and was no longer recorded. The accounts of the new firm would be given by the following table:
| New [Phone and Chip] Company | ||
|---|---|---|
| Revenue from sales (\(\$\)) | 200 | |
| Expenses (wages) (\(\$\)) | 150 | |
| Profit (\(\$\)) | 50 | |
- The \(\$200\) measure would remain unchanged— as it should. We do not want our measure of aggregate output to depend on whether firms decide to merge or not.
- 2 - GDP is the sum of value added in the economy during a given period.
The value added by a firm is defined as the value of its production minus the value of the intermediate goods used in production.
Thus, the value added by the phone company is equal to the value of the phones it produces minus the value of the chip it uses in production, \(\$200 - \$100 = \$100\). Total value added in the economy, or GDP, equals \(\$100 + \$100 = \$200\).
- 3 - GDP is the sum of incomes in the economy during a given period.
So far, we have looked at GDP from the production side. The other way of looking at GDP is from the income side.
Aggregate production and aggregate income are always equal.
From the income side, valued added in the two-firm example is equal to the sum of labour income (\(\$150\)) and capital or profit income (\(\$50\)), i.e., \(\$200\).
Nominal vs Real GDP
US GDP is almost \(\$25,000\) billion in 2021, compared to \(\$543\) billion in 1960. Was US output really almost \(40\) times higher in 2021 than in 1960?
Obviously Not
Nominal GDP is the sum of the quantities of final goods produced times their current price.
Nominal GDP increases for two reasons:
- The production of most goods increases over time.
- The price of most goods increases over time
Our goal is to measure production and its change over time.
we need to eliminate the effect of increasing prices (i.e. inflation) on our measure of GDP.
That’s why real GDP is constructed so that we can measure changes in actual output and remove the impact of inflation.
Real GDP - is the sum of quantities of final goods times (X) constant prices -not current-
If the economy produced only one final good, say, a single car model, constructing real GDP would be easy:
We would use the price of the car in a given year and multiply the quantity of cars produced in each year.
| Year | Quantity of Cars | Price of Cars | Nominal GDP | Real GDP (in 2012 Dollars) |
|---|---|---|---|---|
| 2011 % | 10 | $20000 | $200000 | $240000 |
| 2012% | 12 | $24000 | $288000 | $288000 |
| 2013 % | 13 | $26000 | $338000 | $312000 |
The figure above plots the evolution of both nominal GDP and real GDP since 1947. By construction, the two are equal in 2017.
Real GDP in 2021 was about 6 times its level of 1960—a considerable increase, but clearly much less than the 40-fold increase in nominal GDP over the same period.
The difference between the two results comes from the increase in prices over the period.
Nominal GDP is also called dollar GDP, or GDP in current dollars.
Real GDP is also called GDP in terms of goods, GDP in constant dollars, GDP adjusted for inflation, or GDP in chained (2017) dollars, or GDP in 2017 dollars.
Average standard of living: Real GDP per person
We have focused so far on the level of real GDP. This is an important number that gives the economic size of a country.
the level of real GDP per person, the ratio of real GDP to the population of the country.
It gives us the average standard of living of the country.
Growth Rate of US GDP - 1950-2022
In assessing the performance of the economy from year to year, economists focus however on the rate of growth of real GDP, often called just GDP Growth.
Periods of positive GDP growth are called expansions. Periods of negative GDP growth are called recessions.
Since 1950, the US economy has gone through a series of expansions, interrupted by short recessions.
The figure below shows all expansions and recessions since 1950 in a grey area.
The 2008–2009 recession and the recent Covid-19 period are the most severe recession in the period from 1950 to 2022.
Growth rate calculation:
- Let \(Y_{t}\) denotes real GDP in year \(t\).
- GDP growth in the United States since 1950 is given below.
- GDP growth in year \(t\) is constructed as
- and expressed as a percentage
\[\frac{Y_{t} - Y_{t-1}}{Y_{t-1}}\]
Unemployment
Because it is a measure of aggregate activity, GDP is obviously the most important macroeconomic variable.
But two other variables, unemployment and inflation, tell us about other important aspects of how an economy is performing.
What is it then?
Employment is the number of people who have a job.
Unemployment is the number of people who do not have a job but are looking for one
According to the International Labour Organization (ILO) definition,
an unemployed person is a person aged 15 or over:
without a job during a given week;
available to start a job within the next two weeks;
actively having sought employment at some time during the past four weeks or having already found a job that starts within the next three months.
Labour Force = Employment + Unemployment
- The labour force is the sum of employment and unemployment. \(L = N + U\)
The unemployment rate (\(u\))
- (\(u\)) is the ratio of the number of people who are unemployed to the number of people (\(U\)) in the labour force (\(L\)). \[u = \frac{U}{L}\]
How to measure?
Difficult!
Many countries rely on large surveys of households to compute the unemployment rate.
The U.S. Current Population Survey (C P S) relies on interviews of 60,000 households every month.
The two measures of unemployment used in the UK are the Claimant count and the Labour Force Survey. Between the two, the Labour Force Survey (click for more information) is considered a more accurate measure of unemployment.
A person is unemployed if he or she does not have a job and has been looking for a job in the last four weeks.
Those who do not have a job and are not looking for one are counted as not in the labour force.
Discouraged workers are those persons who give up looking for a job and so no longer count as unemployed.
The participation rate is the ratio of the labour force to the total population of working age.
Because of discouraged workers, a higher unemployment rate is typically associated with a lower participation rate.
Why it matters?
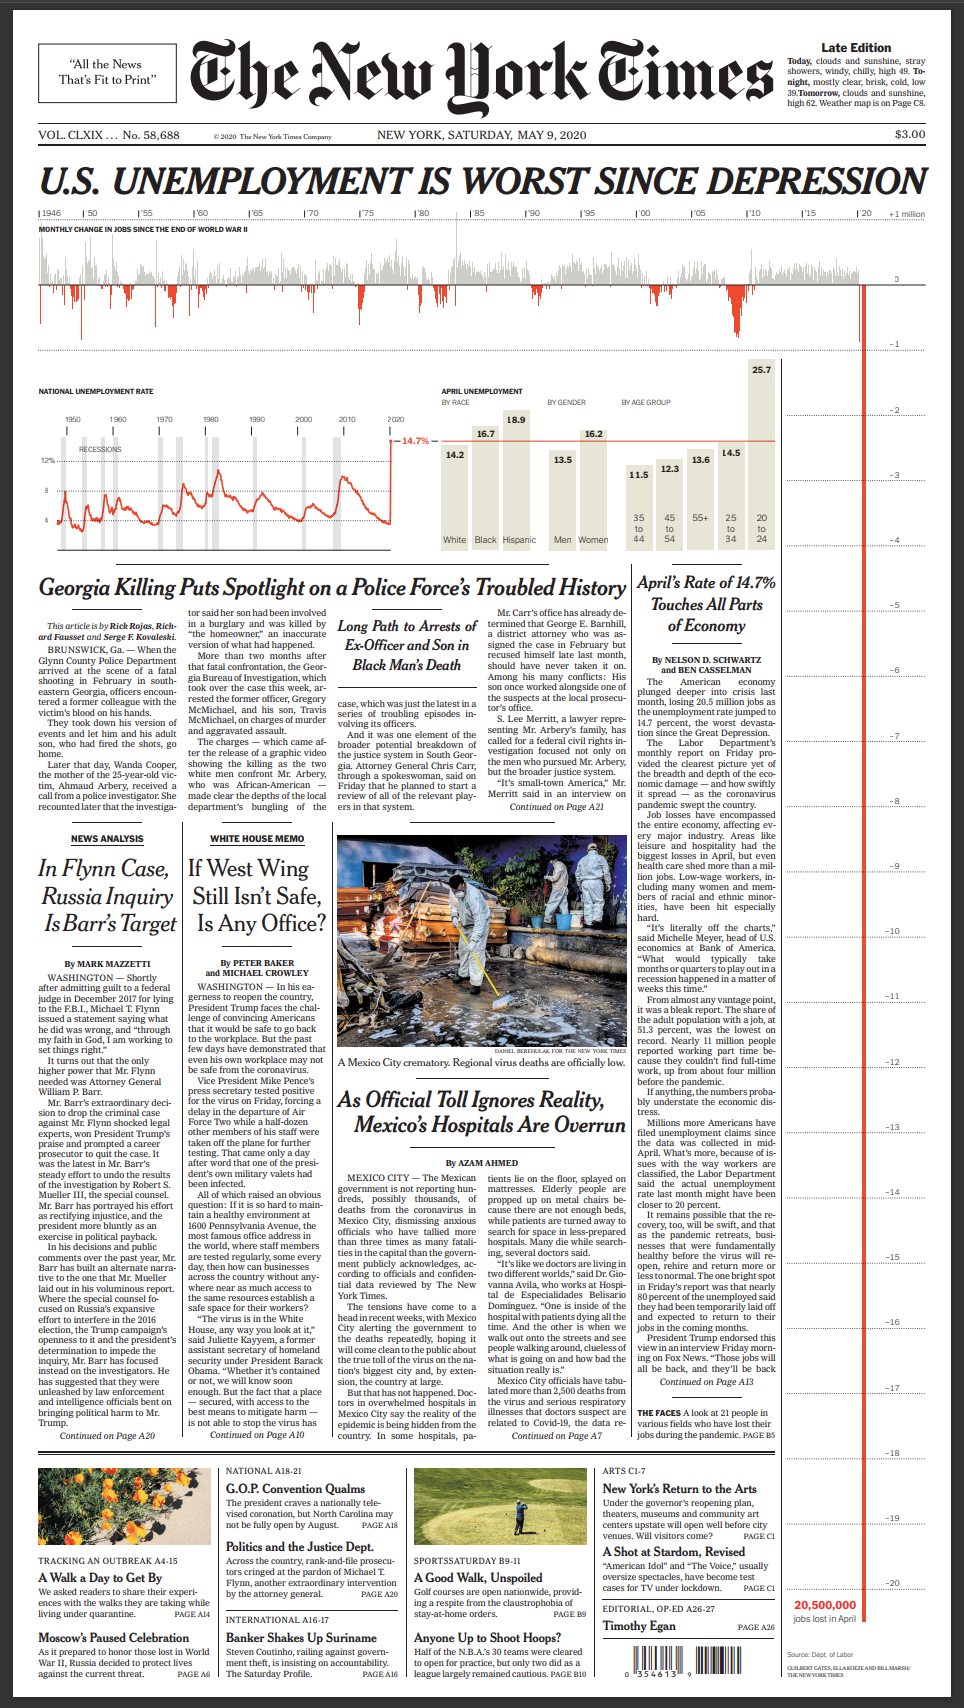
Why Do Economists Care about Unemployment?
Because of its direct effect on the welfare of the unemployed, especially those remaining unemployed for long periods of time.
It is a signal that the economy is not using its human resources efficiently.
When unemployment is high:
- Many workers who want to work do not find jobs; the economy is clearly not using its human resources efficiently.
What about when unemployment is low?
- An economy in which unemployment is very low may be overusing its resources and run into labour shortages (particularly for skilled workers).
Unemployment and Happiness
To give you a sense of scale, other studies suggest that this decrease in happiness is close to the decrease triggered by a divorce or a separation. In other words, unemployment is a major life event that has a significant impact on happiness.
Inflation
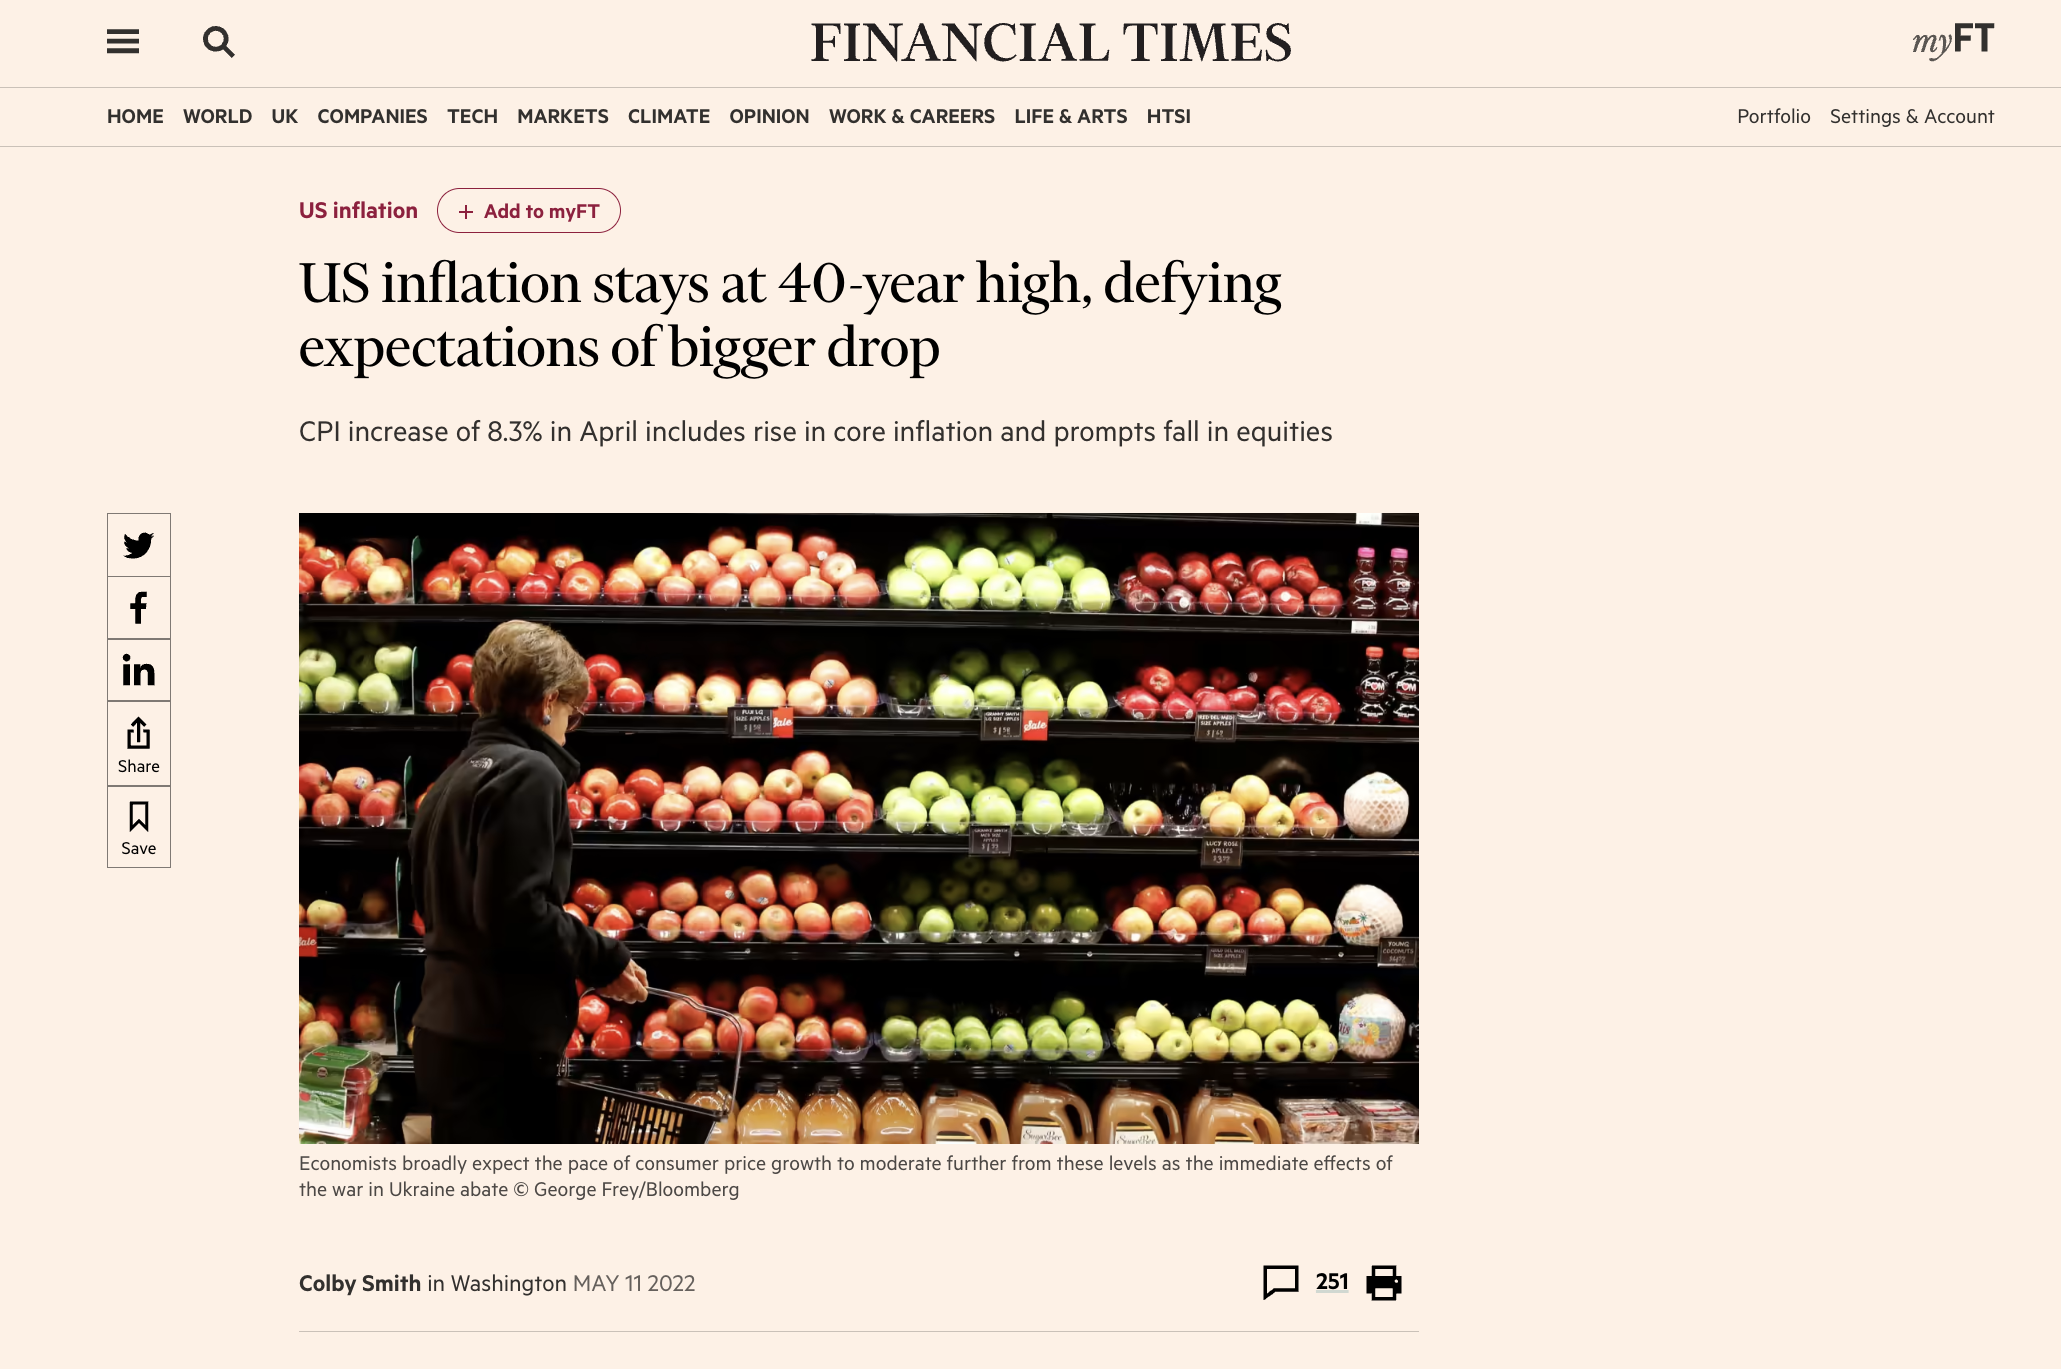
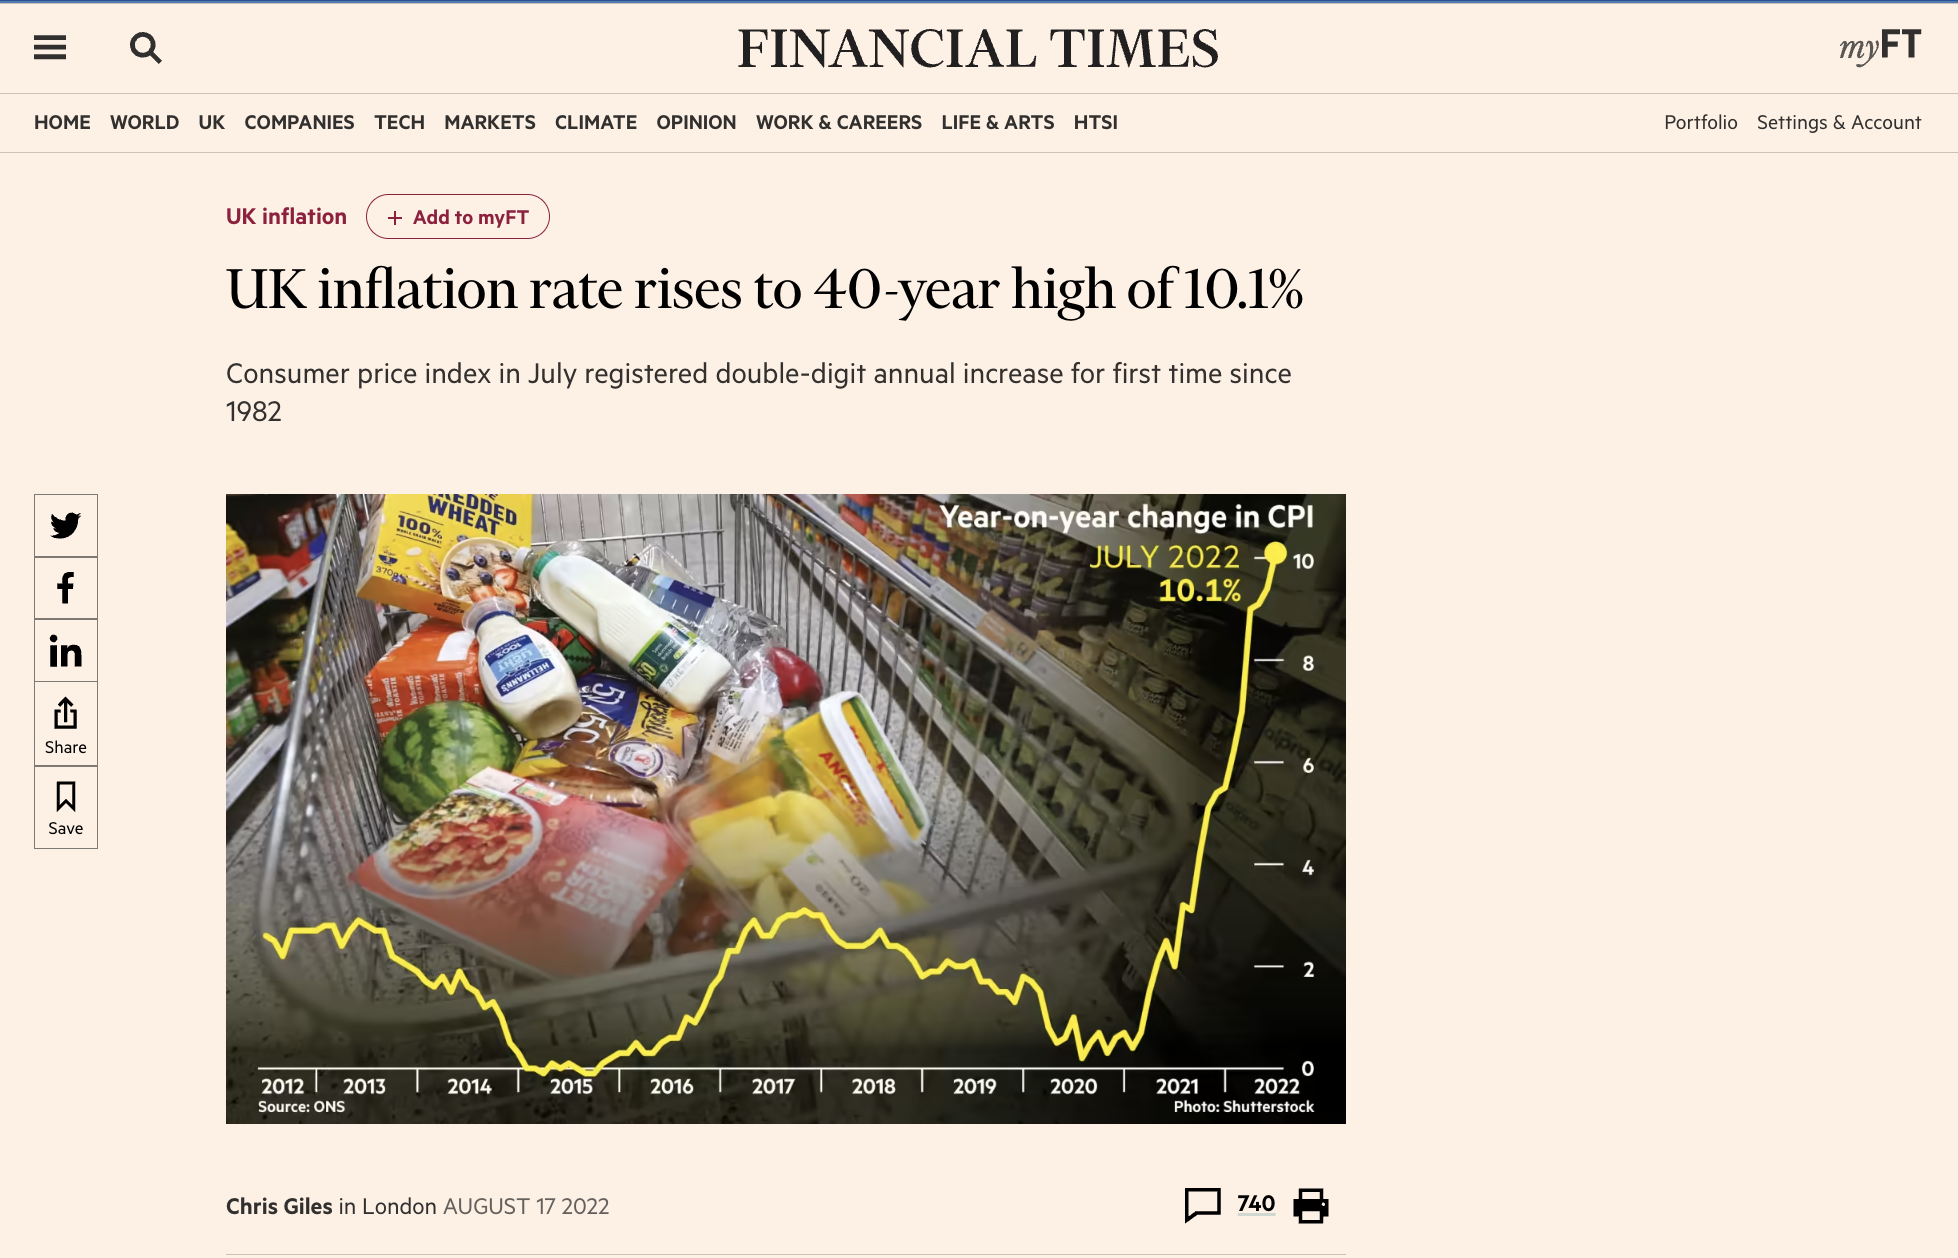
Inflation is everywhere!
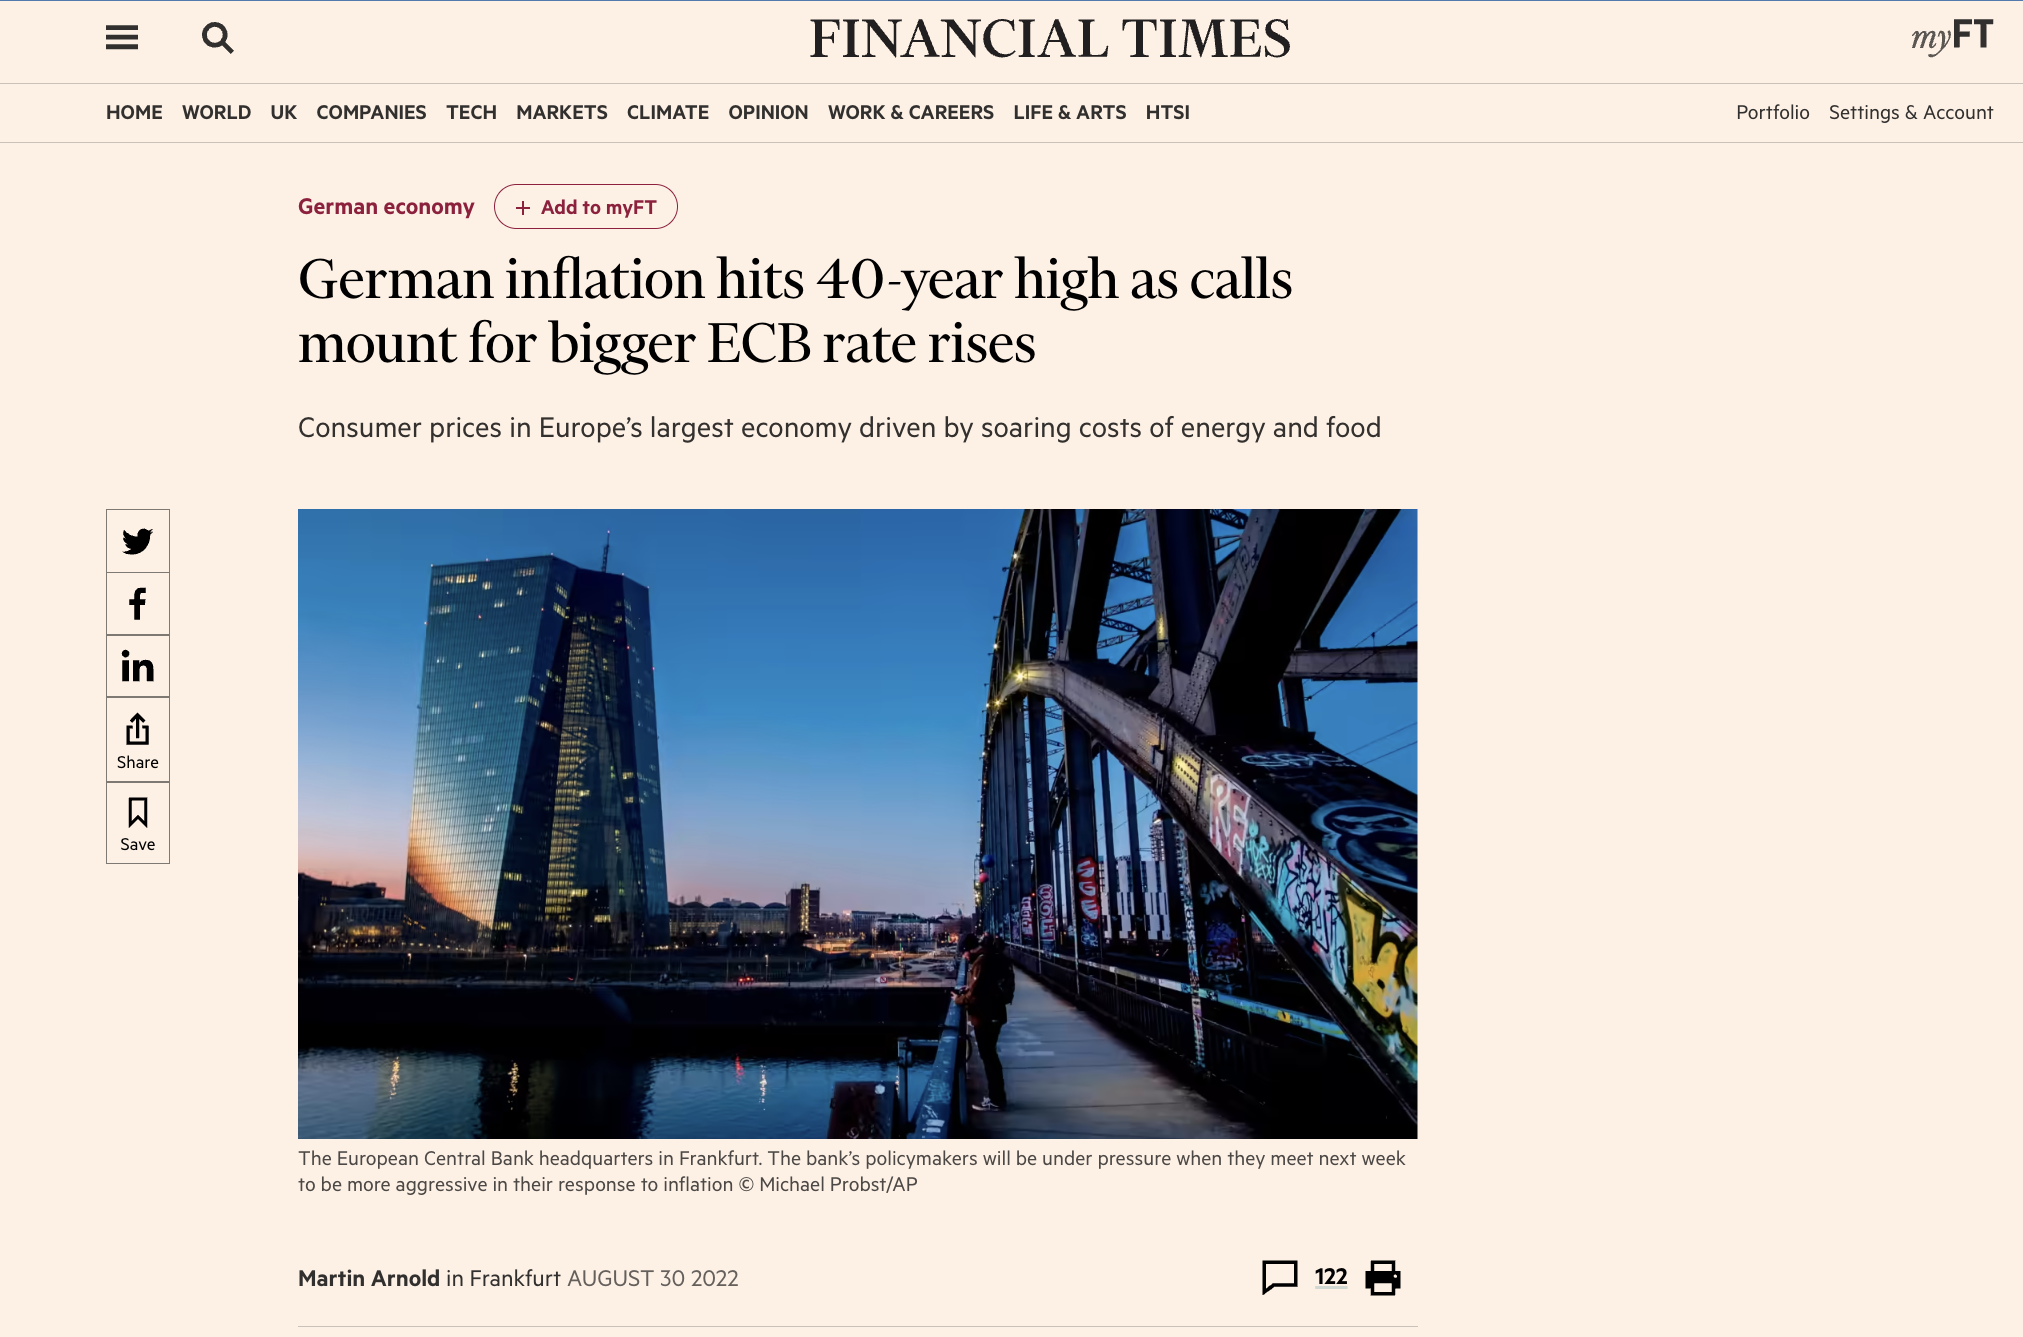

What is Inflation?
Inflation is a sustained rise in the general level of prices—the price level.
The inflation rate is the rate at which the price level increases.
Deflation is a sustained decline in the price level (negative inflation rate).
Both can be good or bad.
Macroeconomists typically look at two measures of the price level, two price indexes:
- the GDP deflator and
- the Consumer Price Index.
UK CPI - From ONS
In principle, the basket of goods and services should contain all consumer goods and services purchased by households and the prices measured in every shop or outlet that supplies them.
In practice, a sample of prices for a selection of representative goods and services in a range of UK retail locations is used.
Currently, around 180,000 separate price quotations are used every month in compiling the measures, covering around 700 representative consumer goods and services.
These prices are collected in around 140 locations across the UK and from the internet and over the phone at ONS.
More: What’s in the basket of goods? 70 years of shopping history
The GDP Deflator
- The GDP deflator in year t, \(P_t\), is defined as the ratio of nominal GDP to real GDP in year t:
\[P_t=\frac{Nominal GDP_{t}}{Real GDP_t} = \frac{\$Y_t}{Y_t}\]
The GDP deflator is called an index number (1 in 2012), which has no economic interpretation.
The rate of change has a clear interpretation: the rate of inflation.
\[\pi_{t}= \frac{P_{t} - P_{t-1}}{ P_{t-1}}\]
But this (\(\pi_{t}\)) has a clear economic interpretation: It gives the rate at which the general level of prices increases over time — the rate of inflation.
Defining the price level as the GDP deflator implies a simple relation between nominal GDP, real GDP, and the GDP deflator:
\[\$Y_t =P_t \times Y_t\]
Nominal GDP is equal to the GDP deflator times real GDP.
The rate of growth of nominal GDP is equal to the rate of inflation plus the rate of growth of real GDP
The GDP deflator gives the average price of output—the final goods produced in the economy.
But consumers care about the average price of consumption—the goods they consume. The two prices may not be the same.
The Consumer Price Index
The set of goods produced in the economy is not the same as the set of goods purchased by consumers because:
Some of the goods in GDP are sold not to consumers but to firms, to the government, or to foreigners.
Some of the goods bought by consumers are not produced domestically but are imported from abroad.
The Consumer Price Index (CPI) is a measure of the cost of living.
The CPI is published monthly by the national static agency for the US this is the Bureau of Labor Statistics (BLS), which collects price data for 211 items in 38 cities.
For the UK this is Office for National Statistics (ONS). The ONS uses around 700 items to calculate the rate of inflation.
The CPI gives the cost in dollars of a specific list of goods and services over time.
Why Inflation Matters?
Pure inflation is a proportional increase in all prices and wages.
This type of inflation causes only a minor inconvenience as relative prices are unaffected.
Real wage (wage measured by goods rather than dollars) would be unaffected.
However, there is no such thing as pure inflation.
Inflation affects income distribution when not all prices and wages rise proportionally.
Inflation leads to distortions due to uncertainty, some prices that are fixed by law or by regulation, and its interaction with taxation (bracket creep in taxes).
Most economists believe the “best” rate of inflation to be a low and stable rate of inflation between 1 and 4%.
What about deflation?
If inflation is so bad, does this imply that deflation (negative inflation) is good? The answer is no.
First, high deflation (a large negative rate of inflation) would create many of the same problems as high inflation, from distortions to increased uncertainty.
Second, even a low rate of deflation limits the ability of monetary policy to affect output, look at the Japanese case after 2000.
Okun’s Law: g and u
Okun’s law is a relation first examined by U.S. economist Arthur Okun.
In figure below, the line that best fits the points is downward sloping.
1948-1970: -0.1526 // 1970-1990: -0.1077 // 1990-2010: -0.4220 // 2010-latest: -0.3950
The slope of the line for 1990-2010 is \(–0.42\), which implies that, on average, an increase in the growth rate of \(1\%\) decreases the unemployment rate by \(-0.42\%\).
Output growth that is higher than usual is associated with a reduction in the unemployment rate.
Output growth that is lower than usual is associated with an increase in the unemployment rate.
The Phillips Curve
The Phillips curve is a relation first explored in 1958 by New Zealand economist A.W. Phillips.
Figure below plots the change in the inflation rate against the unemployment rate, along with the line that best fits the points.
The lines are downward-sloping, meaning that higher unemployment leads, on average, to a decrease in inflation, and vice versa.
A low unemployment rate leads to an increase in the inflation rate.
A high unemployment rate leads to a decrease in the inflation rate.
